One assumption, buried past the years you can actually forecast, usually decides 60–80% of a DCF's answer. Here's why it carries that much weight, why it has a hard speed limit, and how to stop trusting a number you haven't stress-tested.
The Number Past the Edge of Your Chart
Every DCF forecasts a handful of years in detail, then quietly answers a much bigger question in one line: what happens to this business forever after that? That single growth assumption — usually 2 to 3 percent, sometimes a single keystroke's difference from the number next to it — moves the final price target more than almost anything else in the model.
Three concepts — work through them in order or jump to the one you need.
"You'd never size a trade off a single candle you can't even see forming three years out. A DCF asks you to do exactly that — and most people don't realize how much weight that invisible candle is carrying."
Think about how a swing trader reads the right edge of a chart. You've got clean price action for the last year, and then it just... stops. Nobody knows what happens next, so nobody pretends to draw it. A DCF has the same honesty problem, except it isn't allowed to shrug. It has to forecast five or ten years of cash flow, then answer for everything after that — decades of a business's life — with one lump-sum number called terminal value. And here's the part that catches almost everyone off guard the first time they build a model: that single number, built off one growth assumption, usually makes up 60% to 80% of the entire valuation. Nail the five-year forecast and botch that one growth number, and you've still gotten the price wrong — possibly by a lot.
Take the last year you actually forecast, grow it one more year by the terminal growth rate (g), and divide by the gap between your discount rate (WACC) and that same rate. That's it. That's the formula standing in for a company's entire existence beyond year five or ten.
| Terminal Growth (g) | Terminal Value | Share of Total DCF Value |
|---|---|---|
| 2.0% | $2.19B | 69% |
| 2.5% | $2.37B | 71% |
| 3.0% | $2.58B | 73% |
Same $150M final-year free cash flow, same 9% WACC, held constant across all three rows above. The only thing changing is the terminal growth rate — half a percentage point at a time. That alone swings terminal value by nearly $400 million, and pushes the terminal value's share of the total answer from 69% to 73%. Nothing about the business changed. Only the assumption did.
A chartist would never let one unverified assumption about a candle they can't see decide 70% of their conviction on a trade. Yet that's exactly the role the terminal growth rate (g) plays in a DCF unless you treat it with the same suspicion you'd give a target derived from a single, thinly-traded print.
Next: the terminal growth rate (g) isn't just important — it's mathematically dangerous past a certain point. Here's the hard ceiling it has to respect.
Next Concept →"A breakout that projects to infinity on a log chart would get laughed out of the room. A terminal growth rate that creeps too close to WACC does the same thing to a DCF — it just hides the absurdity inside a fraction."
Look back at the formula: TV = FCF × (1 + g) / (WACC − g). Watch what happens to the denominator as the terminal growth rate (g) creeps up toward WACC. It gets smaller and smaller. And dividing by a number approaching zero sends the result toward infinity. Set that rate equal to WACC and the model breaks completely — undefined, meaningless. Set it even just uncomfortably close, and you get a terminal value so inflated it no longer resembles a real business.
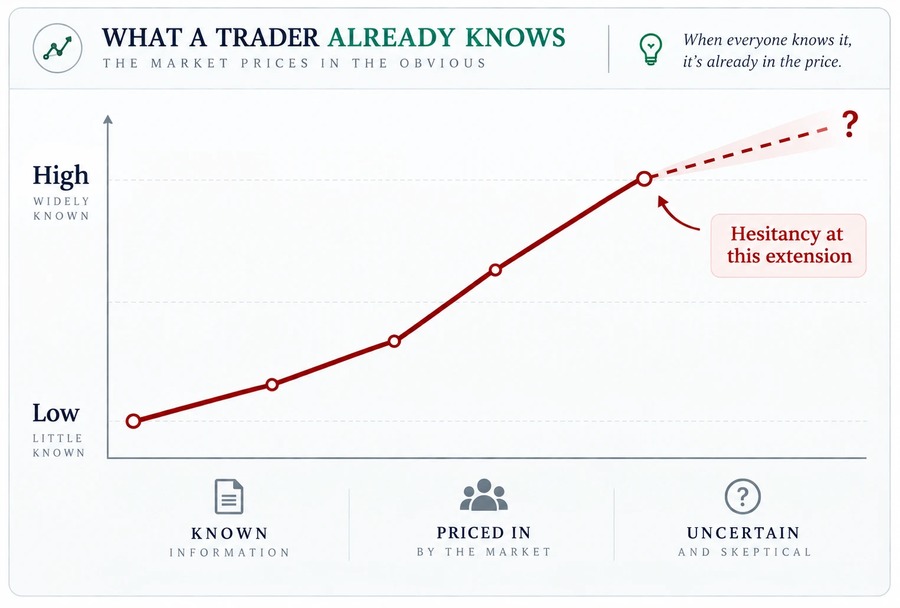
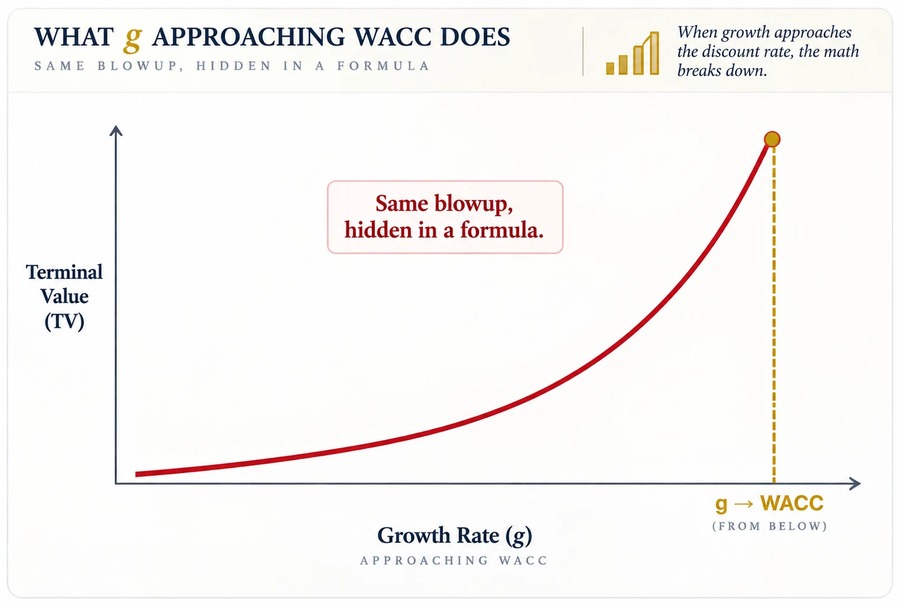
That's why practitioners anchor the terminal growth rate (g) to long-run nominal GDP growth, typically 2% to 3%, and treat anything meaningfully above that as a claim that needs real justification, not a default setting.
If you ever see a model — yours or someone else's — using a terminal growth rate above 4-5%, or sitting within a couple points of WACC, treat the resulting price target the way you'd treat a stock up 40% in three days on no news: technically real, structurally unstable, and one revision away from collapsing back to earth.
The chart version of an unsustainable move is visually obvious. The DCF version hides inside two variables sitting a few points apart in a denominator. Same phenomenon, same conclusion, just dressed differently.
In the Micron pre-earnings deep dive, IU explicitly capped terminal growth at 2.5% despite the memory supercycle narrative implying much faster multi-year growth — because supercycle pricing is cyclical, not perpetual, and baking a boom-year growth rate into "forever" would have overstated fair value by construction, not by insight.
Knowing the speed limit tells you what to avoid. The next step is a practical checklist for picking a defensible number in the first place.
Next Concept →"A stop-loss placed 'because that's what I always use' gets blown through eventually. A terminal growth rate picked the same way does too."
Most terminal growth rates in the wild are set one of two ways: copied from the last model someone built, or defaulted to "2.5%, seems reasonable." Neither is a real answer. A defensible terminal growth rate (g) comes from actually asking what kind of business you're modeling and where it sits in its own life cycle — the same way a trader sizes a stop based on the actual volatility of the setup, not a habit.
1. Where does this industry sit on the maturity curve? A early-innings industry (data center power, HALEU enrichment) can plausibly sustain above-GDP growth for a decade before decelerating toward a terminal rate — but the terminal rate itself, the number applying after that runway, should still fade toward GDP-level growth, not freeze at the boom-year pace.
2. Does the growth rate imply reinvestment the business can't fund? Growth isn't free — it requires capital. A terminal growth assumption that's inconsistent with the company's actual reinvestment rate and returns on capital is internally contradictory, even if the number itself looks conservative in isolation.
3. Does it survive a second method? Cross-check the Gordon Growth terminal value against the exit-multiple method (applying a market-based EV/EBITDA multiple to final-year earnings instead). If the two approaches land within a few percent of each other, that's real corroboration. If they diverge sharply, the growth assumption — not the multiple — is usually the one worth revisiting first.
A company with $150M in final-year free cash flow and a 9% WACC produces a Gordon Growth terminal value of roughly $2.37B at a terminal growth rate (g) of 2.5%. Cross-checked against an 11x exit multiple on $218M of final-year EBITDA, the exit-multiple method lands at roughly $2.40B — within 2% of the growth-based figure. That agreement is the corroboration; it's the reason to trust the 2.5% assumption instead of just hoping it's right.
A terminal growth rate you can defend with a maturity argument, a reinvestment check, and a second method that agrees with it is a modeling input. One you picked because it "seemed fine" is a guess wearing two decimal places. Only one of those deserves to move a position size.
You now know why the terminal growth rate (g) matters and how to defend one. Next: see exactly how much a single assumption like this one can swing your final price target — and how IU turns that range into a conviction level, not a hedge.
Explore Sensitivity Analysis →